Climate Graphs
Reading a Climograph
A Climate graph firstly has a type of biome that is associated with the place and i usually displayed at the top of the graph with the place where the measurement of temperature and participation took place. The climate graph then uses a scale to indicate the precipitation in inches. At the bottom of the graph it displays the first letter of the month and on the right side of the graph is the temperature. A line graph just above the bar graph shows monthly temperature during the year.
desert Weather
Desert Climate seems to have one peak point which is usually around the middle of the year displaying very humid climates around June to September. Precipitation on the other hand seems to rise quite significantly when the climate is not at 'Peak Point'.
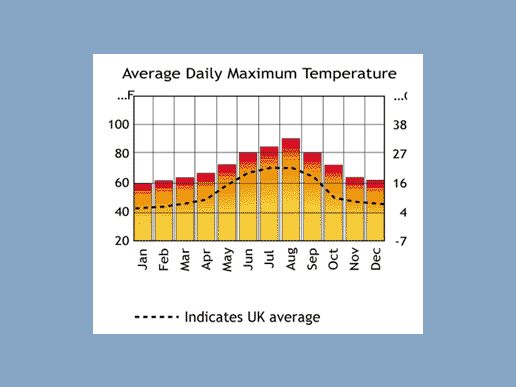
Example of a Climate Graph
